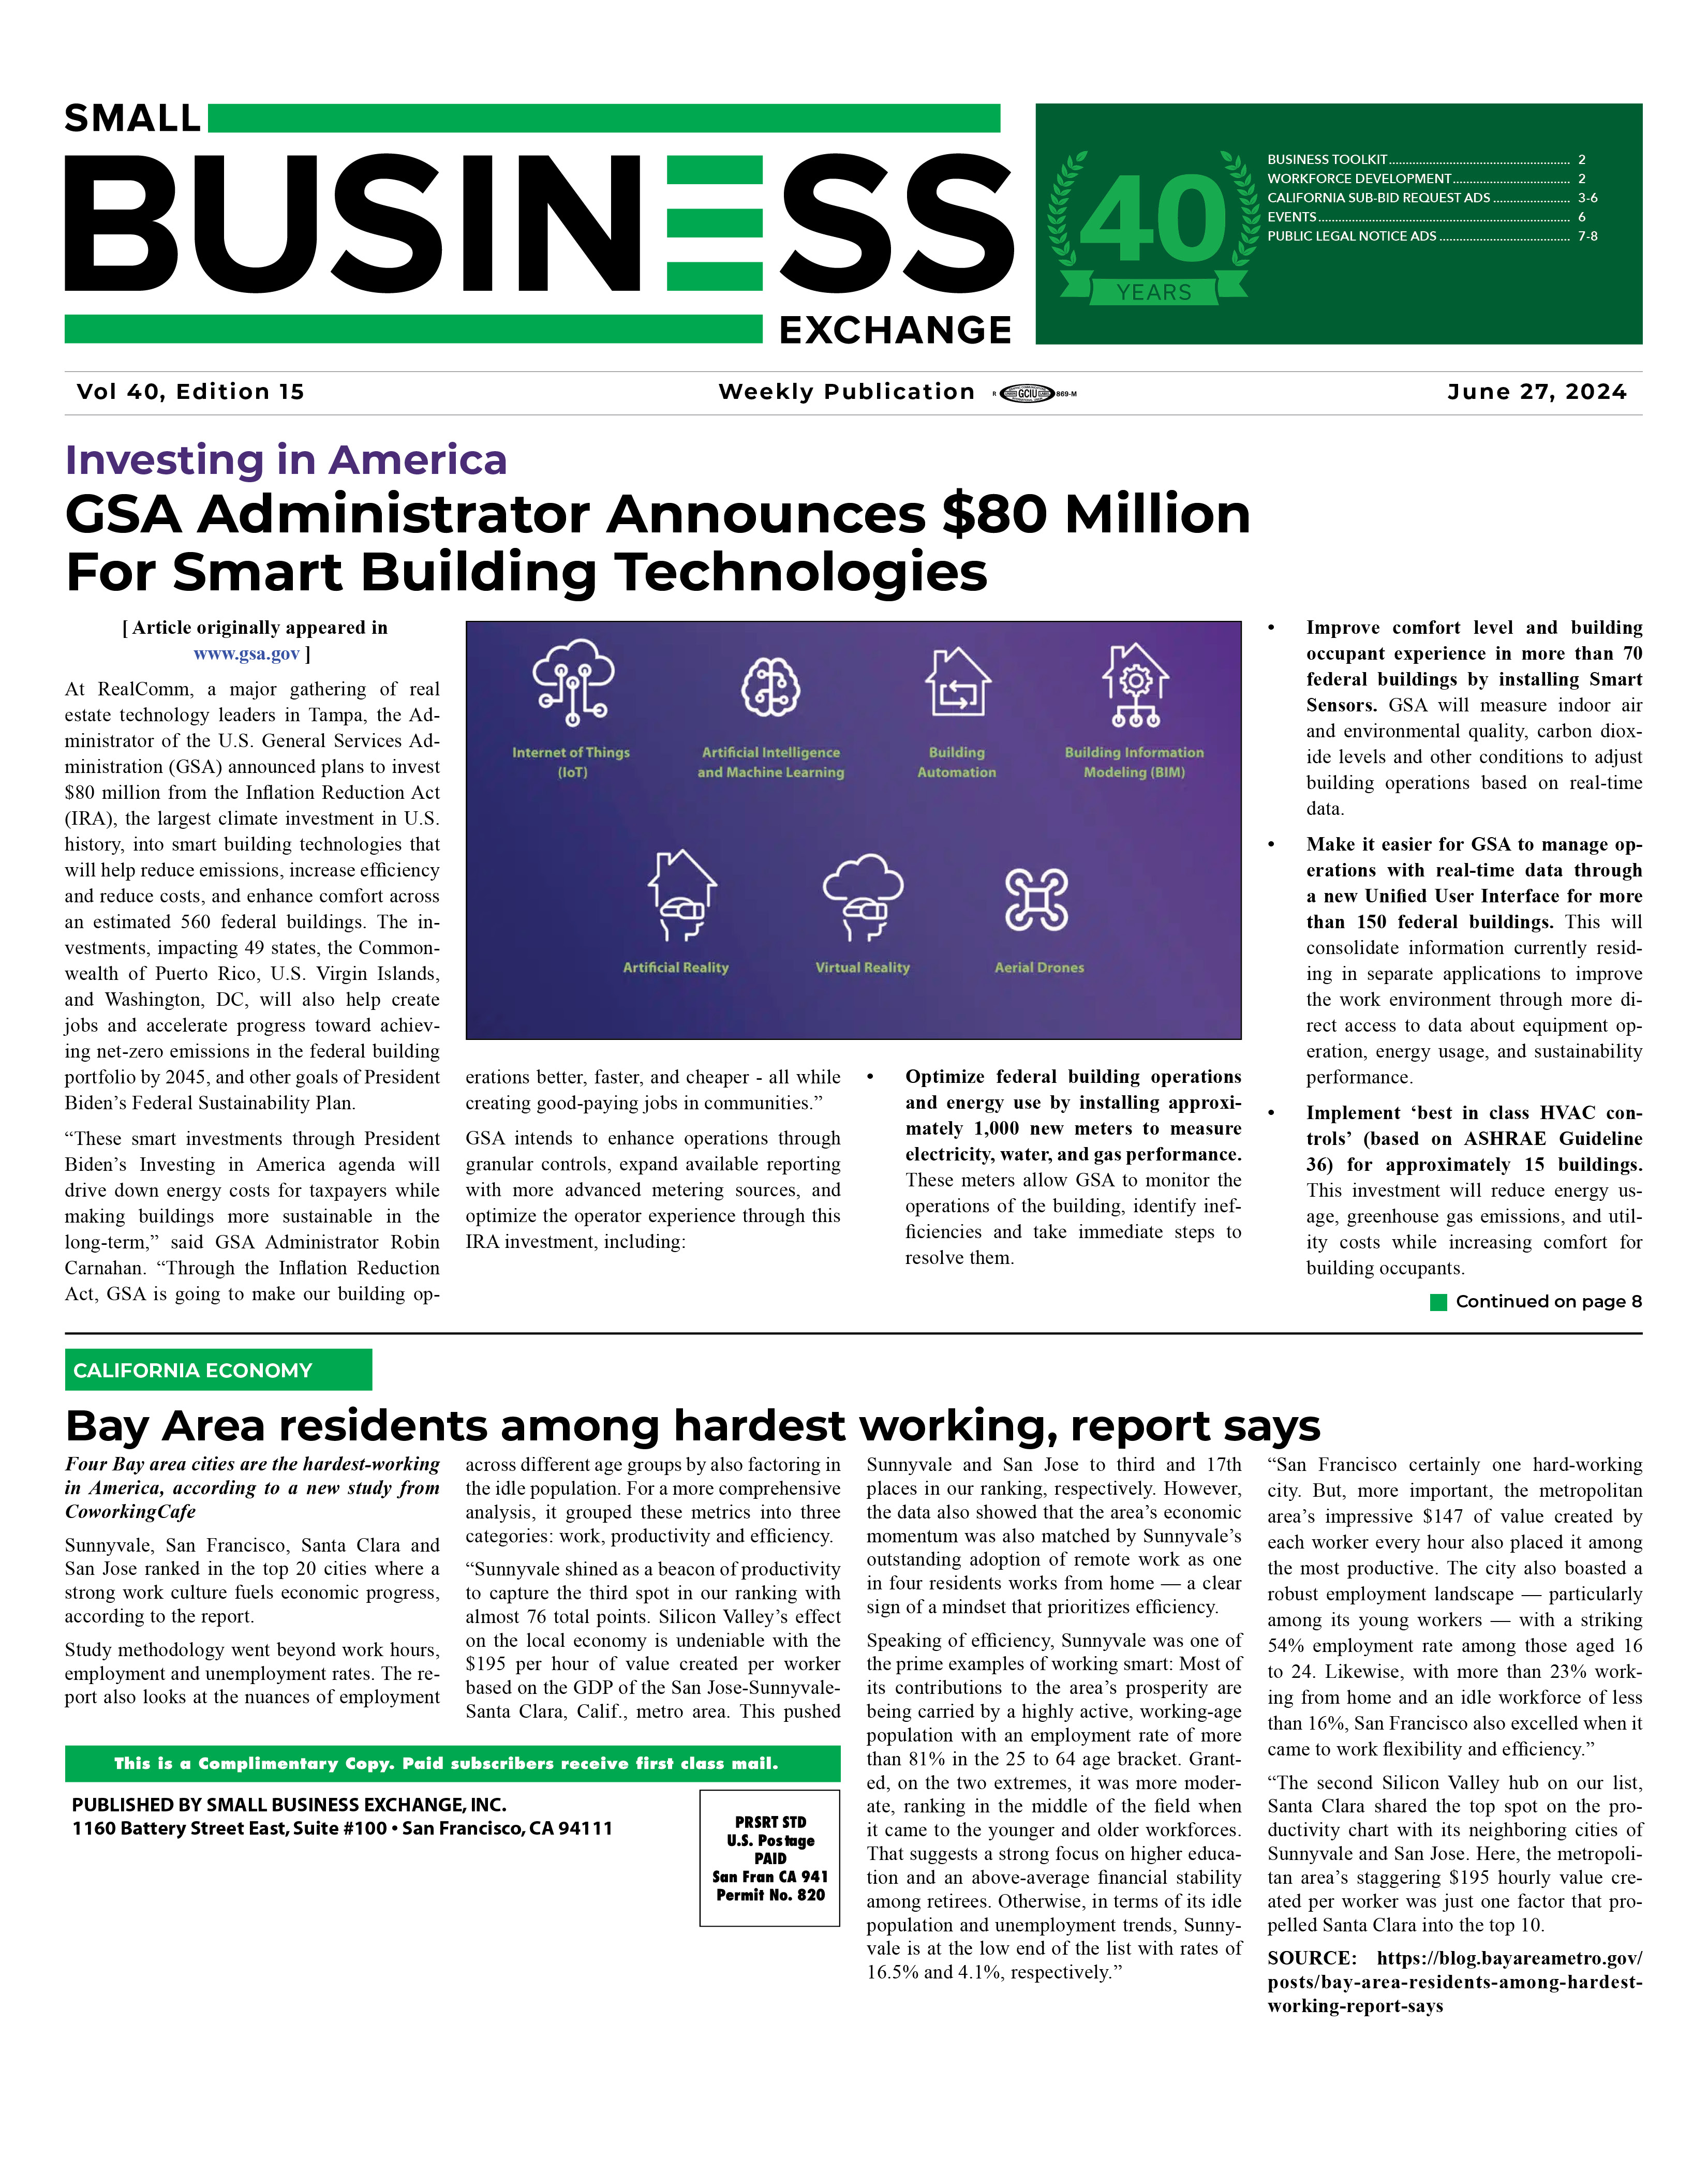
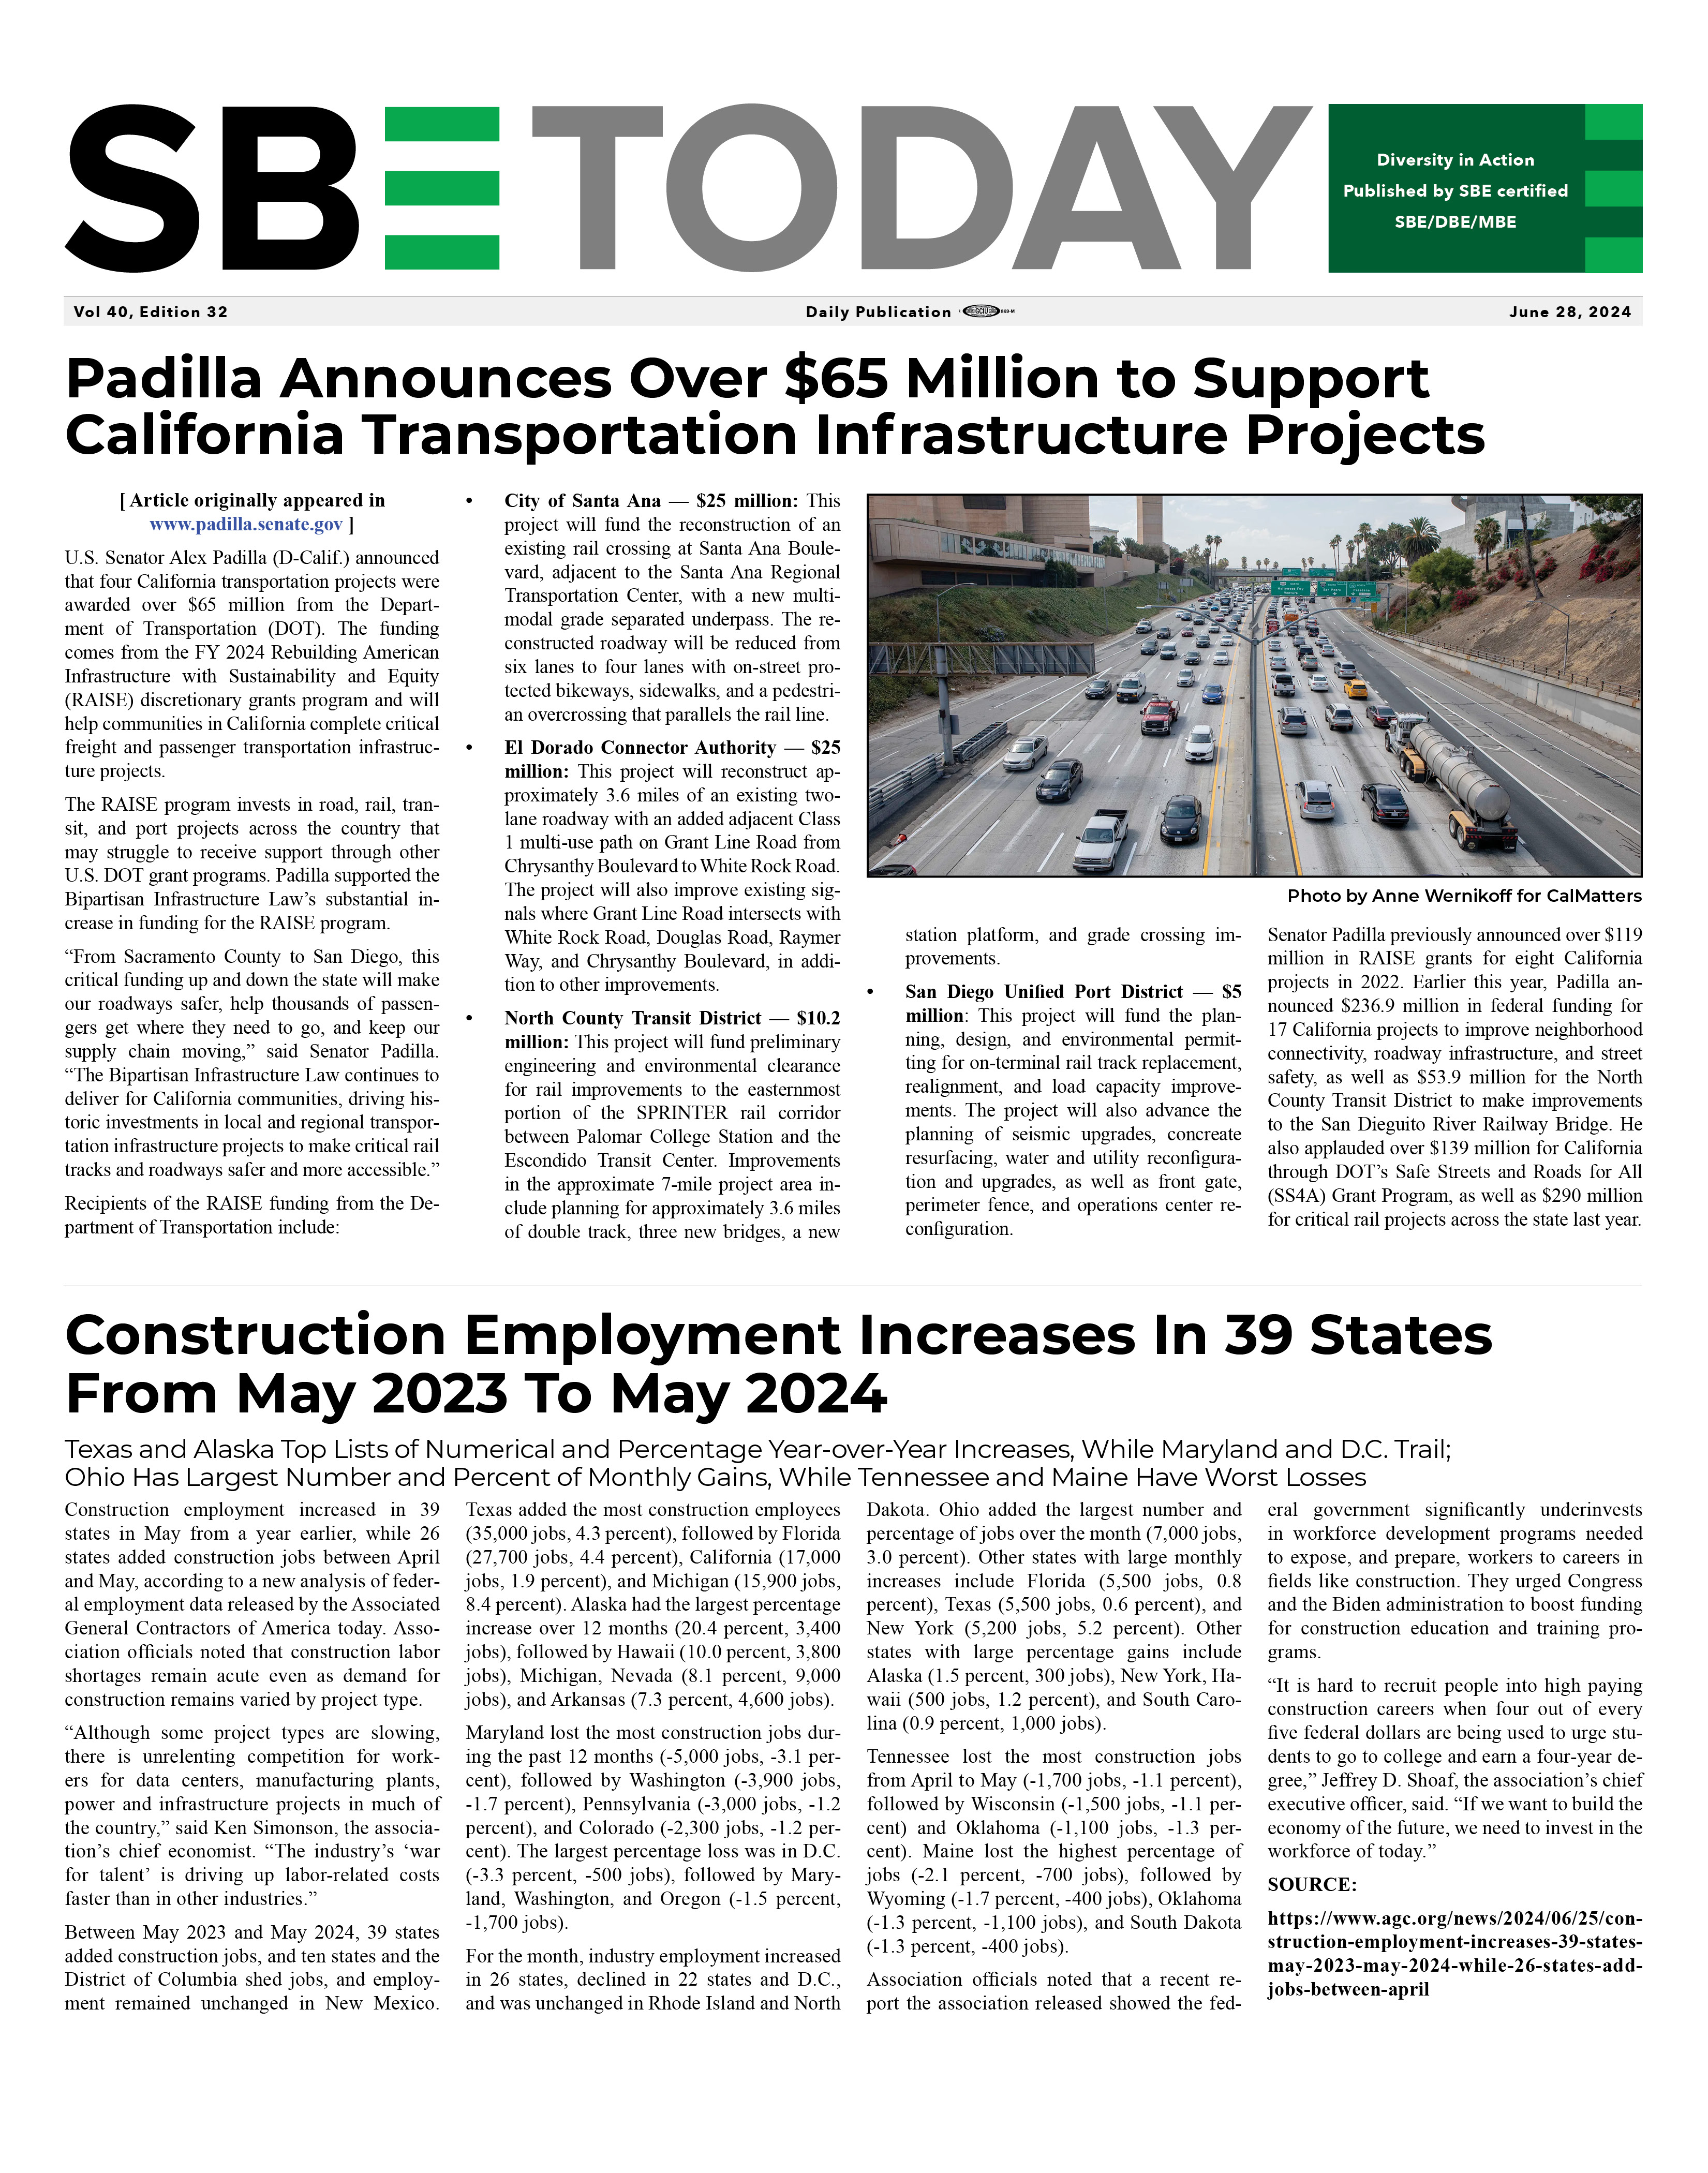
|
|
Asian-American and Pacific Islander Heritage Month: May 2019
05/15/2019
In 1992, Congress expanded the observance to a month-long celebration that is now known as Asian-American and Pacific Islander Heritage Month. Per a 1997 U.S. Office of Management and Budget directive, the Asian or Pacific Islander racial category was separated into two categories: one being Asian and the other Native Hawaiian and Other Pacific Islander. Thus, this Facts for Features contains a section for each. The following facts are made possible by the invaluable responses to the U.S. Census Bureau’s surveys. We appreciate the public’s cooperation as we continuously measure America’s people, places and economy. Asian PopulationDid You Know?
22.2 millionThe estimated number of Asian alone or in combination residents in the United States in 2017. Source:
5.0 millionThe estimated number of the Asian population of Chinese, except Taiwanese, descent in the United States in 2017. The Chinese (except Taiwanese) population was the largest Asian group, followed by Asian Indian (4.4 million), Filipino (4.0 million), Vietnamese (2.1 million), Korean (1.9 million) and Japanese (1.5 million). These estimates represent the number of people who reported a specific detailed Asian group alone, as well as people who reported that detailed Asian group in combination with one or more other detailed Asian groups or another race(s). Source: Source:
53.0%The percentage of the Asian alone or in combination population age 25 and older who had a bachelor’s degree or higher level of education in 2017. Source:
87.5%The percentage of the Asian alone or in combination population age 25 and older who had at least a high school diploma or equivalency in 2017. Source: More Stats
See a detailed profile on the Asian population from the 2017 American Community Survey. Statistics include:
Native Hawaiian and Other Pacific Islander PopulationDid You Know?
1.6 millionThe estimated number of Native Hawaiian and Other Pacific Islander alone or in combination residents of the United States in 2017. Source:
614,572The number of Native Hawaiian residents of the United States in 2017. The Native Hawaiian population was the largest detailed Native Hawaiian and Other Pacific Islander (NHPI) group, followed by Samoan (202,268) and Guamanian or Chamorro (156,482). These estimates represent the number of people who reported a specific detailed NHPI group alone, as well as people who reported that detailed NHPI group in combination with one or more other detailed NHPI groups or another race(s). Source:
7.1%The percentage of Native Hawaiian and Other Pacific Islander alone or in combination military veterans in 2017. Source:
23.3%The percentage of the Native Hawaiian and Other Pacific Islander alone or in combination population age 25 and older who had a bachelor’s degree or higher in 2017. Source:
89.4%The percentage of the Native Hawaiian and Other Pacific Islander alone or in combination population age 25 and older with at least a high school diploma or equivalency in 2017. Source:
5,157The estimated number of Native Hawaiian and Other Pacific Islander-owned employer firms in the United States in 2016.
See a detailed profile on the Pacific Islander population from the 2017 American Community Survey. Statistics include:
The Census Bureau released results from the 2020 Census Barriers, Attitudes and Motivators Study (CBAMS). Click here to understand and compare barriers, attitudes and motivators across demographic subgroups such as Asian, Black, Hispanic, White, and additional groups like income and education levels. ###
The following is a list of observances typically covered by the Census Bureau’s Facts for Features series:
African-American History Month (February) Editor’s note: The preceding data were collected from a variety of sources and may be subject to sampling variability and other sources of error. Facts for Features are customarily released about two months before an observance in order to accommodate magazine production timelines. Questions or comments should be directed to the Census Bureau’s Public Information Office: telephone: 301-763-3030; or e-mail: pio@census.gov. Profile America's Facts for Features provides statistics related to observances and holidays not covered by Stats for Stories. For observances not listed below, visit our Stats for Stories web page. Profile America's Stats for Stories provides links to timely story ideas highlighting the Census Bureau's newsworthy statistics that relate to current events, observances, holidays, and anniversaries. The story ideas are intended to assist the media in story mining and producing content for their respective audiences. Dates with Presidential Proclamations are marked with (P). SOURCE: https://www.census.gov/newsroom/facts-for-features/2019/asian-american-pacific-islander.html Back To News |
|