|
|
Top 25 U.S. Cities for School Construction Starts
02/14/2019
[ Article was originally posted on www.constructconnect.com ]
By Alex Carrick, There are 51 metropolitan statistical areas (MSAs) in the United States with population levels above 1 million. Drawing from ConstructConnect’s data pool for those 51 cities, Table 1 ranks the Top 25 markets in America for educational facility construction starts last year. (Map 1 showcases the Top 20.)
Leading all cities was the Big Apple, New York, with groundbreakings on school projects valued at $3.4 billion. In second place, not far behind, was Dallas-Ft. Worth, at $3.1 billion. The Dallas portion of the $3.1 billion was two-thirds (67%) and the Fort Worth portion, one-third (33%). Near the summit of the rankings, also, were: Los Angeles and Houston, each at $2.6 billion; and Seattle-Tacoma, $1.6 billion. In the latter dual-city combo, Seattle was 70% and Tacoma 30%. There was another twin city result that was noteworthy. In San Francisco-Oakland (8th spot), the former’s piece of the pie was only 37% while the latter’s slice was a more taste-satisfying 63%. Among the 25 MSAs in Table 1, significantly large year-over-year percentage change gains were recorded by: Portland, +202%; Sacramento, +193%; Las Vegas, +129%; Providence, +80%; San Diego, +67%; Cleveland, +59%; and Raleigh, +54%. While they wouldn’t have made it into the Top 25 cities in Table 1, several smaller centers with populations of less than 1 million each also managed high levels of educational facility starts in 2018: Madison, Wisconsin, $476 million; New Haven, Connecticut, $464 million; and El Paso, Texas, $407 million. Educational facility construction work is carried out at four different levels of learning: ‘preschool and elementary’; ‘junior and senior high school’; ‘college and university’; and ‘special and vocational schools’. (Schools for the sight and hearing impaired are included among the ‘special’ category.) For the entire U.S., ‘junior and senior high school’ starts accounted for the biggest portion of the total dollar volume of educational facility starts in 2018, at 43%. The shares taken by ‘preschool and elementary schools’ and ‘colleges and universities’ were almost the same, 28% and 27% respectively. ‘Special and vocational schools’ were only a small part of the mix, 2%. With respect to dollar volumes in 2018 versus 2017, and across the whole nation, ‘junior and senior high school’ starts were +14.1%; ‘preschool and elementary’ school starts, +1.8%; ‘special and vocational school’ starts, -1.8%; and ‘college and university’ starts, -15.5%. Map 1: Top 25 Ranking of Major U.S. Cities by Total Value of Educational Facility Construction Starts: 2018 (in $ billions) 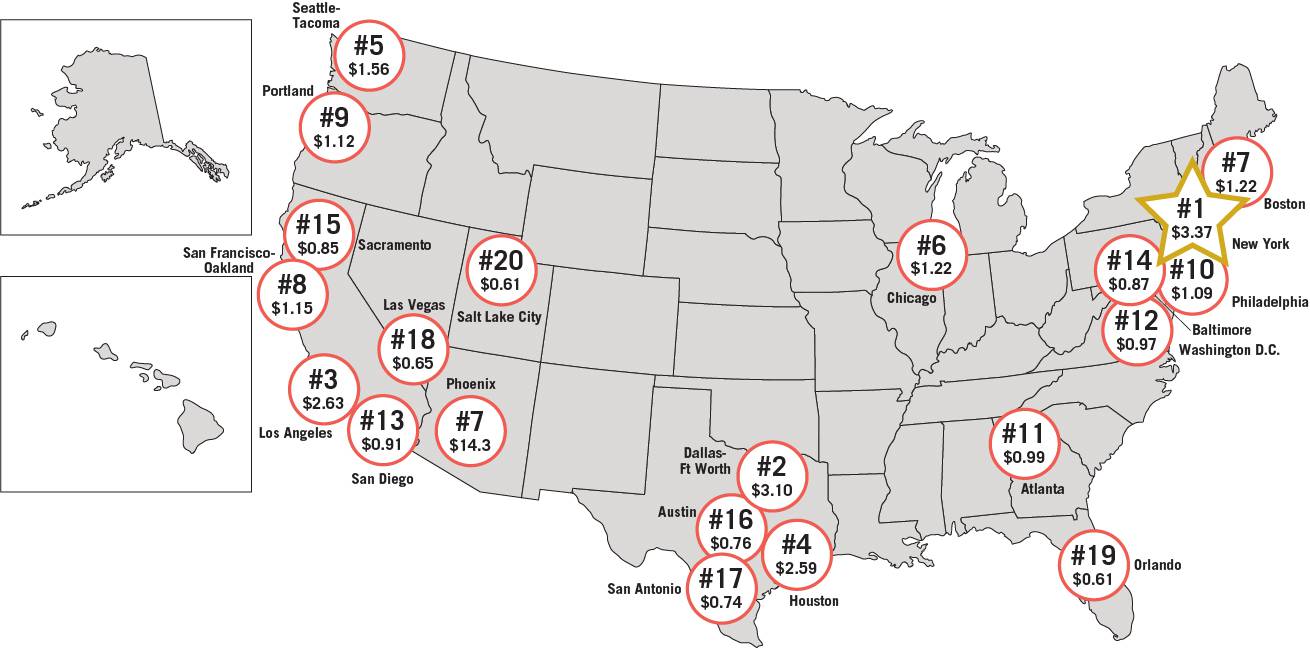
Data Source and Map: ConstructConnect.
Table 1: Educational Facility Construction Starts
*There are 51 metropolitan statistical areas (MSAs) in the U.S. with populations exceeding 1 million.
Data Source and Table: ConstructConnect.
Back To News |
|
|||||||||||||||||||||||||||||||||||||||||||||||||||||||||||||||||||||||||||||||||||||||||||||||||||||||||||||||||||||||||||||||||||||||||||||||||||||||||||||||||||||||||||||||||||||||||||||||||||||||||||